LCROSS finds water on the moon
 credit: NASA
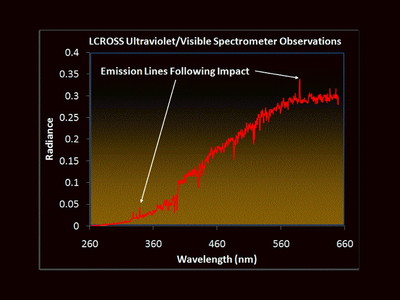
As noted on the mission pages for the Lunar CRater Observation and Sensing Satellite (LCROSS), the team has posted data that indicates they have found water at the southern pole of the moon, LCROSS Impact Data Indicates Water on Moon
During the 4am local time of the impact, Samantha Blair, a visiting researcher from the SETI Institute was taking data while I got up to make sure the telescopes and backends were functioning properly and offer a hand should a problem crop up just before the observation.
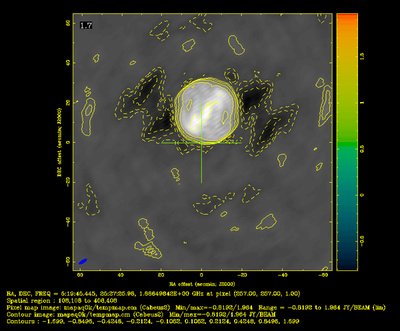
The ATA observation was acquired at 1.666GHz, with 6.5MHz of bandwidth to look for spectra corresponding to OH emission and you can see detailed notes from the observation on the HCRO LogBook, LCROSS quick check reduction from that data taken during the impact.
The field of view at 1.666GHz is about 4 times the size of the moon. You can see why this is true if you go back to the relationship of field of view or “beam width” to the frequency being observed over the diameter of the telescope involved, or: F = λ / d
For an interferometer, not only is the field of view important, but the statistical distribution of distances between individual antennas (also known as baselines). The more “long” baselines you have, the more fine detail you can see in the resulting image. The more “short” baselines, the larger scale detail is visible. Combine them together and you end up with good detail at all scales. The current configuration of the ATA-42 is limited to baselines of about 300m, while the 350 will have baselines of up to 2km.
 credit: Samantha Blair, Colby Gutierrez-Kraybill
So, picking out detail for the impact with the ATA-42 is very difficult. The image you see is also polluted with various systematic problems and will require several hours of sitting down and tweaking various parameters before giving up on finding anything. Data was also acquired at 7GHz for continuum emission, essentially to attempt seeing some of the thermal energy being released during the impact.
Another part of the system called the beamformers were taking high resolution spectra, using a sub-beam centered over the expected impact location. Unfortunately, no OH has showed up in any of our data, but, it was a long shot that we’d be able to see it using the ATA-42. Given 350 dishes to increase the overall sensitivity of the system and the higher resolution from 2km baselines, we’d have a much better chance. Or, it may have been that the sub-beam for the high resolution spectra was not actually centered over the actual impact location.
I hope this illustrates just some of the hard work that goes into these sorts of observations. I should also say thank you to Garrett Keating for providing step by step explanations to help me understand the particulars of imaging with the Allen Telescope Array.